

Shape Maps in Power BI
Thought it was about time to get in shape
This is a bit of a tangent but wanted to share useful links as this is something that I have pulled together with multiple sources and not something that I could find a joined view of.
So maps are tricky. Getting your data in the right format, right place and most difficult correct shape is really difficult. One approach is to focus only on getting your data in the right place by using latitude and longitude to plot data in the correct places but shape maps are definitely the best way to present data about geographies such as Countries, Regions, Local Authorities, Postcode Areas etc.
Out of the box there are a few shape maps like US states, UK countries but for my purposes I need shape maps for Local Authorities, Postcode Areas, Regions and other geographic distributions inside the UK. Custom maps can be loaded and as this article says:
“You can use custom maps with Shape Map as long as they are in the TopoJSON format. If your map is in another format, you can use online tools such as Map Shaper to convert your shapefiles or your GeoJSON maps into the TopoJSON format.”
In Power Maps (plugin for excel) this is achieved through Shape or KML files but in here we need TopoJSON. On the ONS Geoportal you need to go to the APIs rather than downloads for the GeoJSON link for whichever boundary you are wanting. Going to the URL and saving the JSON file locally you can then load it into Map Shaper and export as TopoJSON in the top right hand corner.
So that gives you any boundary published by the ONS as a format that can be loaded into Power BI, from a bit of testing the associated shape data can be matched according to any of the parameters so for Local Authority that is the JSON file ID, Local Authority Code or Local Authority name which is pretty helpful.
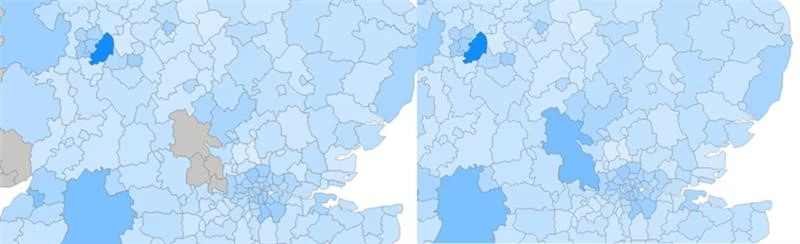
So that is all great until you rightealise that the latest boundary map (at time of writing) is the 2019 Local Authority list and the latest local authority list is 2020 which includes the merging of Aylesbury Vale, Chiltern, South Bucks and Wycombe into Buckinghamshire Local Authority and my data is aligned to the 2020 list. I was able to use this guide to merge together the old local authority boundaries and adapt this one to create field names for the new shape then re-join the maps and…
 So a bit of a tangent but useful set of tools to be able to use shape maps for the geographies that I need and something that can be built on in the future if I need to do something like creating custom region maps that are not available from the ONS.